A fluent response is not proof an LLM app is working. Here is how observability actually shows what happened, and what it cost.
A response that reads well isn't proof an LLM application is actually working. It could have skipped a tool call, retrieved the wrong document, or answered a slightly different question than the one asked, and still produce fluent, plausible-looking text. Observability for llms is what closes that gap: recording what actually happened at each step of a request, not just what came out at the end. This guide covers how llm monitoring and llm telemetry actually work, why observability is a genuinely different problem from traditional application monitoring, and how token metrics and cost attribution fit into the same tracing infrastructure.
Key takeaways
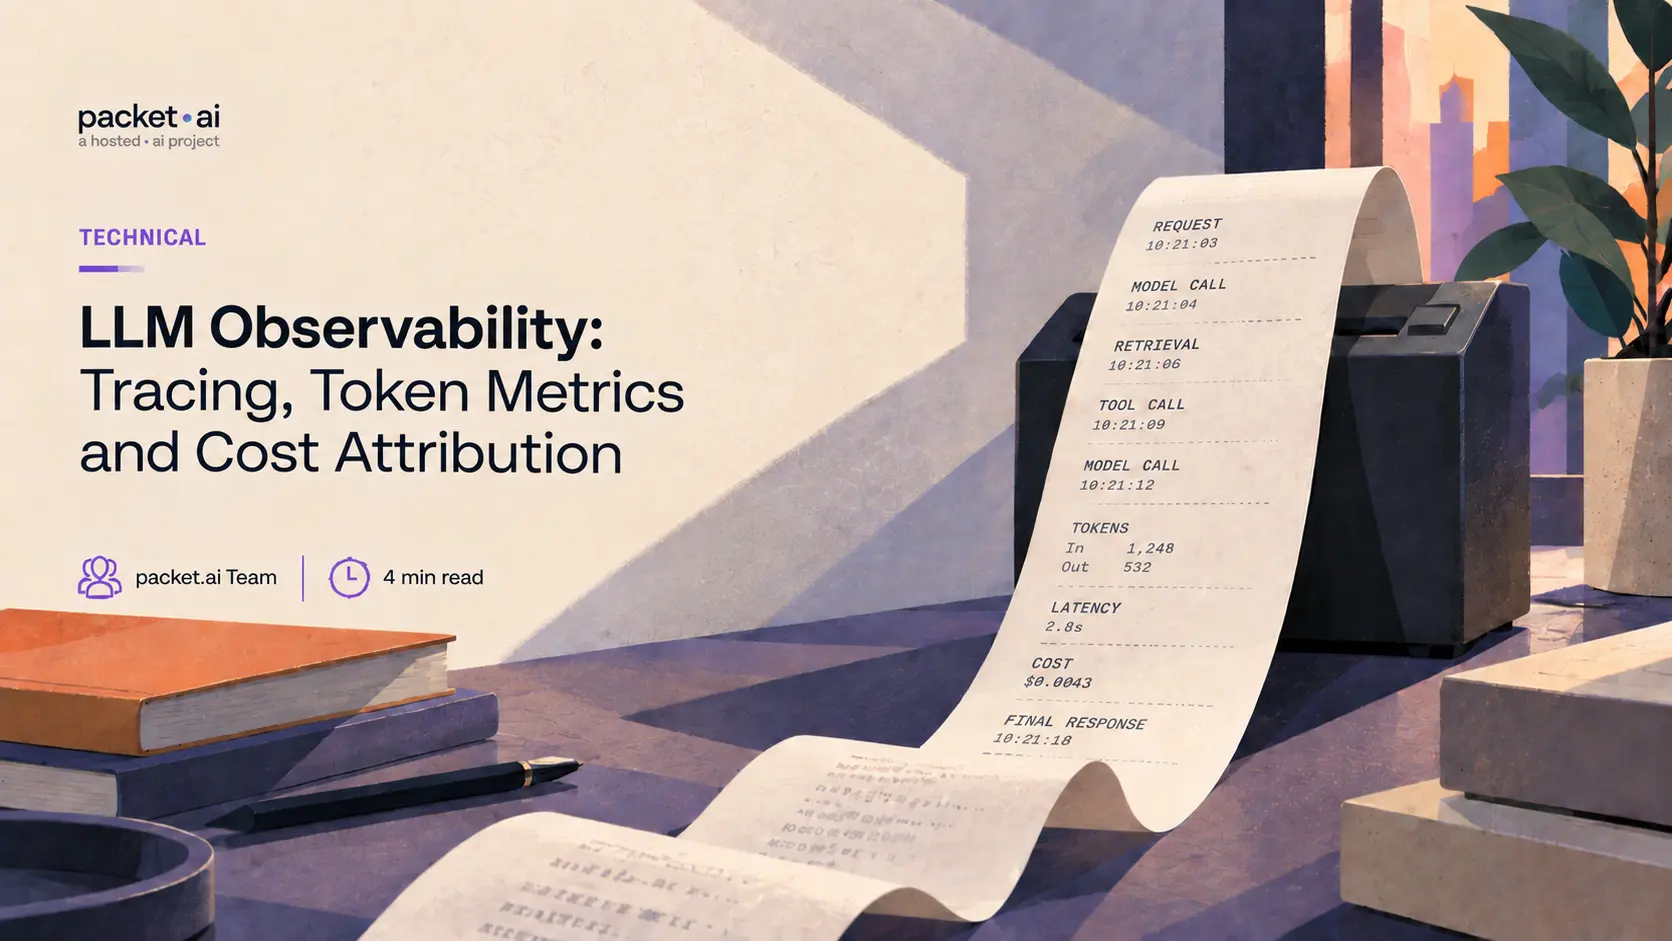
LLM observability is the practice of recording what an LLM application actually did at the level of individual model calls, tool executions, and the data that flowed between them, not just the final output a user sees. For a single request, that means capturing the prompt sent, the response received, which tools were called and with what arguments, which documents were retrieved if the application uses retrieval, and how long each of those steps took.
This granularity matters because the naive way of checking whether an LLM application is working, looking at whether the response reads well, catches crashes and empty responses but nothing more subtle. A model can skip a tool call it should have made, retrieve an irrelevant document, or confidently answer a different question than the one asked, and still produce a response that reads perfectly fine on its own. LLM debugging without this level of detail means guessing at what went wrong from the outside; llm logging and observability are what actually let you see the steps behind a response, not just the response itself.
Traditional application monitoring is heavily focused on request paths, infrastructure health, latency, errors, and service dependencies, and modern distributed systems already have plenty of nondeterminism and multi-step behavior of their own. LLM observability needs everything that traditional monitoring covers, plus a set of concepts that don't exist in a typical HTTP request: model identity, the actual prompt and response content, token usage, which tools were called, what was retrieved, and the sequence of steps an agent took to arrive at an answer. The same prompt can also produce a different output each time it's run, so reproducing and diagnosing an issue isn't as simple as replaying the exact same input and expecting the exact same result. Usage and cost tracking work differently too, since cost accrues per token rather than per request, and a single request's cost can vary enormously depending on how much context it processed and how long its response ran.
This is why LLM observability tends to require more than adapting an existing application monitoring setup. It needs traces structured specifically around the concepts that actually matter for an LLM call: which model was used, how many tokens went in and came out, and what steps an agent took across a multi-step workflow, not just whether an HTTP request succeeded.
Each instrumented step in an LLM application, a model call, a tool execution, a retrieval lookup, can be represented as a span, and the full sequence of spans for one request forms a trace. For an agent making several tool calls before producing a final answer, each of those calls is its own child span, producing a complete, inspectable record of the steps the agent took, though not the model's own private reasoning process, which these spans don't expose.
OpenTelemetry's GenAI semantic conventions provide an emerging vendor-neutral schema for structuring these spans, using a gen_ai.* attribute namespace that captures model name, token counts, and finish reason in a consistent way regardless of which specific framework or provider generated the span. As of current documentation, these conventions carry a Development status rather than a finalized Stable one, meaning names and structures can still change, so treating gen_ai.* as a settled schema rather than an evolving one is worth avoiding. Auto-instrumentation packages exist for major frameworks and providers, meaning a meaningful amount of prompt tracing can be added to existing code through initialization changes rather than rewriting application logic throughout. Dedicated llm tracing tools built on top of this standard typically add layers like prompt versioning and human annotation on top of the raw trace data.
⚡ Instrument to a standard, not a vendor
Three LLM observability vendors were acquired by larger companies within a few months of early 2026: ClickHouse acquired Langfuse in January, Mintlify acquired Helicone in March, and Cisco acquired Galileo in May. That consolidation isn't a reason to avoid dedicated LLM observability tools, but it is a real argument for instrumenting to an open standard like OpenTelemetry's GenAI conventions rather than directly to a specific vendor's proprietary tracing format. Code instrumented against an open standard is generally easier to move between backends; code written directly against a vendor's proprietary API can create meaningfully more migration work if that vendor changes. Several current tools already accept OpenTelemetry traces natively, which means the standard and vendor choice aren't mutually exclusive.
Token counts captured as attributes on each LLM call span are what make cost attribution possible at a granularity finer than a single aggregate monthly bill. When a request is also tagged with dimensions like a user ID, feature name, or customer ID, that same token data can be associated with those dimensions and then aggregated across them, turning an otherwise opaque total into a number you can actually attribute to something specific.
This connects directly to the token-level cost mechanics covered in the packet.ai LLM inference cost guide: observability is the layer that actually makes those cost mechanics visible and attributable in a running application, rather than something you can only estimate after the fact from a monthly invoice. Llm cost tracking and token usage tracking at the trace level are also what make it possible to answer specific operational questions, which feature is driving disproportionate cost, which user segment generates the most expensive requests, without needing to guess from an aggregate number. Because traces can contain prompts, outputs, tool arguments, and retrieved content, production instrumentation also needs appropriate controls for sensitive data, retention, and access, rather than capturing everything by default.
Observability and the underlying serving infrastructure are separate concerns that need to work together: observability tells you what happened and what it cost, while the serving layer determines what a given request actually costs to run in the first place. packet.ai's Token Factory bills per token with usage data intended to be exposed at that same granularity, so cost attribution work doesn't have to be reconstructed manually from a single monthly total. It's currently in private preview, with the specific model catalog and pricing still being finalized.
Join the waitlist for early access once it opens.
Last reviewed: September 17, 2026. LLM observability tooling and standards are evolving quickly; verify current instrumentation options against your specific framework's documentation. For the broader cost mechanics token-level tracing makes visible, see the packet.ai LLM inference cost guide.
Same models. Same API. Fraction of the cost. Start free — no credit card required.
Start Building →