Every GPU owner runs the math. Here is the version that includes actual price bands, real power costs, and the utilization rate that decides whether your fleet earns or just depreciates.
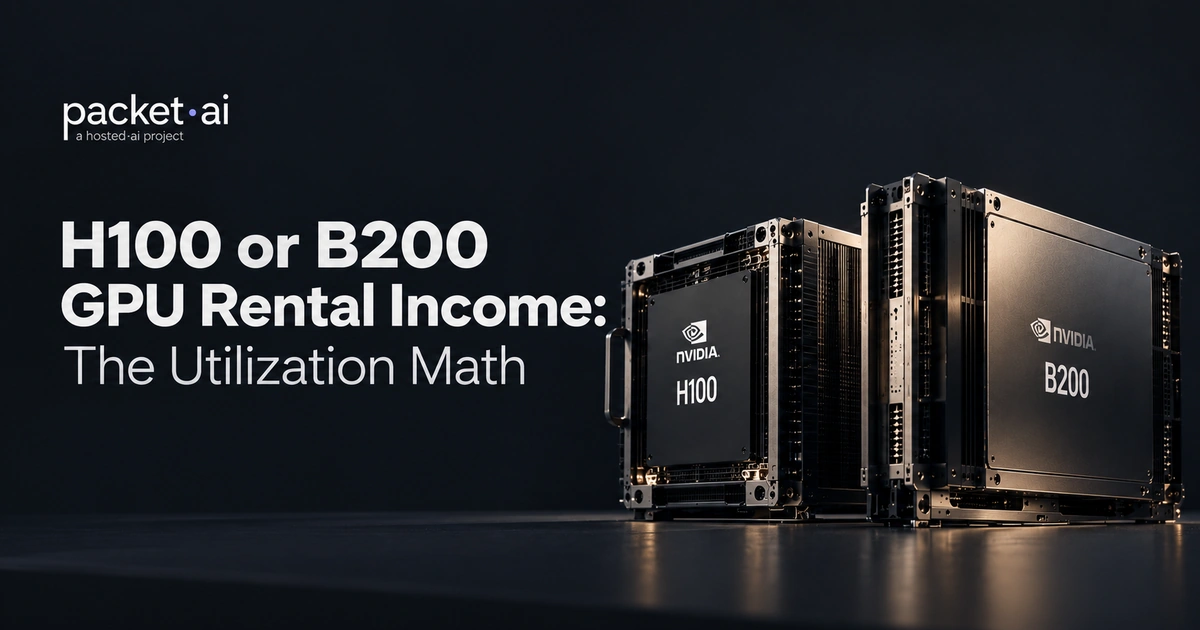
An H100 SXM hosted on a GPU marketplace can gross between $613 and $1,183 per month at 60% utilization. A B200 grosses $1,643 to $3,062 at the same occupancy. Both numbers look very different once you subtract platform fees and power. Here is the full model.
Key takeaways
A GPU only earns when it runs. That sounds obvious, but most fleet operators underestimate how much idle time costs them. This post builds the earnings model from scratch: price bands by GPU, then three utilization scenarios, then fees and power. By the end you have a realistic net revenue range, not a best-case headline number. If you own Hopper or Blackwell nodes and are weighing whether to list them, this is the math that tells you if it pencils out.
For live buyer prices, see the packet.ai pricing page. To run your own fleet numbers, use the GPU earnings calculator.
Every GPU hosting revenue calculation comes down to the same three inputs:
Monthly gross revenue
= Market rate ($/GPU/hr)
× Hours in month (730)
× Utilization rate (0 to 1)
Then subtract: platform fee + power cost
The market rate is what buyers pay per GPU per hour. It shifts with GPU model, region, rental type, and supply-demand conditions. Hours in a month is fixed at 730 (30.4 days x 24 hours). Utilization is what fraction of those 730 hours are actually billed. A GPU sitting idle earns zero. A GPU at 90% occupancy earns close to its ceiling.
Platform fees cover what the marketplace provides: customer acquisition, billing, support, and provisioning infrastructure. These are costs every independent GPU operator would otherwise have to build and staff. Power is a fixed monthly line item regardless of occupancy, because datacenter colocation pricing is capacity-based, not usage-based.
The sections below fill each variable with real, sourced numbers.
Price bands change with supply and demand. Every table here carries a date. The figures below come from packet.ai's pricing page and GPU market benchmarking data for October 2026.
* Max monthly gross = high-end market rate x 730 hours at 100% utilization, before fees and power. Actual earnings are lower; see the utilization table below.
The B200 earns more because it does things no earlier GPU can. Its 192 GB of HBM3e handles long-context inference on 70B and 405B parameter models without quantization. Buyers who need that capability have nowhere else to go, which keeps demand steady and pricing firm. H100 SXM nodes remain among the highest-utilization hardware on any marketplace because the installed base of training and fine-tuning pipelines built around Hopper architecture is enormous and does not disappear overnight.
The blended average provider rate across all packet.ai GPU SKUs was $2.84/GPU/hr as of October 2026, per the packet.ai for-providers page. That number sits below the H100 high end and well below the B200 ceiling, because it averages across all GPU tiers and occupancy patterns.
Utilization is what separates a profitable fleet from a hardware depreciation exercise. The table below shows monthly gross revenue for H100 SXM and B200 at three realistic occupancy levels.
These are gross figures before fees and power. Use them to understand the tier differences and utilization impact, not to project bank deposits.
Notice what happens with the B200 at 30%: it still grosses $821 per month, which beats an H100 running at 60% on its low rate ($613). That is the Blackwell premium in practice. Even a lightly occupied B200 out-earns a reasonably busy H100.
Gross monthly revenue per GPU at 60% utilization (before fees and power)
For an 8-GPU H100 fleet, moving from 30% to 90% utilization at the $2.70/hr rate adds approximately $9,461 per month. Over a year, that is $113,530 from the same rack with no additional capital spend. The hardware is not the variable. Occupancy is.
Platform fees
Every GPU marketplace charges for the infrastructure it provides: buyer acquisition, billing, support, and provisioning. Fee structures vary across platforms. According to a September 2026 analysis by MiningBoard, a third-party GPU marketplace tracker, host take-home rates are approximately 85% on Vast.ai and roughly 93% on RunPod. Vast.ai also states that live renter prices run about 25% above what hosts earn on their platform. These are third-party estimates; verify with each vendor directly.
packet.ai's provider rate card is tier-based by GPU SKU and region. The exact split is shared at onboarding. The for-providers page states that providers earn the majority of the customer-billed rate after platform fees. The blended average across all active provider GPUs on packet.ai was $2.84/GPU/hr as of October 2026.
Power draw
Power runs 24/7 whether the GPU is booked or sitting idle. Colocation agreements charge for committed capacity, not actual usage. GPU TDP figures from NVIDIA's published specifications:
TDP figures are from NVIDIA's published GPU specifications. The $0.06 to $0.12/kWh range covers most US and EU datacenter colocation rates. Operators in high-cost markets like California or London should use their actual tariff. Note that GPUs draw significantly less power at idle than at TDP, typically 60 to 100W. That said, most colo contracts price on committed capacity, so the full monthly figure above is the practical cost to budget against.
Net revenue estimate (illustrative)
A single H100 SXM at 60% utilization, $2.05/hr midpoint rate:
Illustrative only. Your net depends on your GPU rate card, power tariff, and actual occupancy. packet.ai's exact provider fee is shared at onboarding.
Same GPU model, same rack, different monthly revenue. It happens more often than people expect. Here is what drives the gap:
Reliability score. Marketplaces rank provider nodes based on uptime, job completion rate, and consistent performance. On packet.ai, this is your Reliability Score. Nodes with higher scores appear earlier in buyer searches and get more demand routed to them automatically. A node that drops mid-job or has repeated connectivity problems gets buried in the listings fast. Consistent stability is not a nice-to-have; it is what converts listed capacity into booked hours.
Region. US East and EU Frankfurt carry higher demand density than some US West markets, because enterprise buyer concentrations are heavier there. A B200 in Virginia can see materially different effective utilization than an identical node in a less-connected location, even at the same listed rate.
Rental type. Dedicated single-tenant nodes price higher than shared configurations. Production inference buyers want a dedicated card with guaranteed performance. Research and batch jobs fill on-demand at lower rates. A fleet that attracts dedicated reservation customers earns more per hour than one that runs mostly spot traffic.
Network throughput. Multi-node training workloads require 1 Gbps minimum connectivity, and cluster jobs need InfiniBand or NVLink fabric. A node that cannot sustain 1 Gbps throughput is excluded from those workloads, which tend to be among the highest-value and longest-running jobs on any marketplace. packet.ai verifies network throughput and port availability before a node goes live.
GPU generation. Blackwell (B200, RTX 6000 Pro) and Hopper (H100, H200) attract different types of work. Blackwell's FP8 throughput and large HBM3e memory pool pull in inference and frontier model jobs. Hopper attracts fine-tuning and training pipelines already optimized for that architecture. The difference is not just price per hour. It is which buyers find your node relevant and how frequently they come back.
Two operators with identical hardware can see a 2x difference in monthly net revenue based purely on how consistently their nodes perform and how well their infrastructure is connected.
The tables above use published rate bands and midpoints. Your actual figures depend on your GPU model, region, power tariff, and realistic utilization for your current setup. The packet.ai GPU earnings calculator takes your specific fleet configuration and outputs a monthly revenue projection with and without power costs.
H100 fleet
$0.92 - $2.84
estimated net per GPU/hr after fees and power (illustrative)
B200 fleet
$2.80 - $5.60
estimated net per GPU/hr after fees and power (illustrative)
Payout cycle
14 days
bi-weekly, direct to your bank account
If the numbers work for your fleet, applying takes about five minutes and applications are reviewed within two business days. Onboarding from approval to first marketplace revenue typically takes about a week.
If you are evaluating whether to buy H100 or B200 hardware to host, the earnings calculator also runs a break-even model against typical acquisition costs. See the B200 page and H100 page on packet.ai for current availability.
Last reviewed: October 2026. Pricing figures are verified against packet.ai's live pricing and for-providers pages. GPU TDP specs are from NVIDIA's published documentation. Market rate ranges for H100 are based on GPU market benchmarking data for October 2026. Refresh quarterly: rates shift with supply and demand. Ready to list your fleet? Browse cluster configurations or apply as a provider.
Same models. Same API. Fraction of the cost. Start free — no credit card required.
Start Building →