Technical
nvidia-smi output explained: every field and what to watch
nvidia-smi packs a dozen readings into one dense table, and each answers a different question. Here is what every default field means and which ones to check first.
nvidia-smi packs a dozen readings into one dense table, and each answers a different question. Here is what every default field means and which ones to check first.
nvidia-smi output explained in one line: a banner shows the driver and the CUDA version it supports, one block per GPU reports state and load, and a process table shows who holds memory, with GPU-Util defined by NVIDIA as the percent of time a kernel was running, not how much of the GPU was used.
Key takeaways
nvidia-smi prints what the NVIDIA driver knows about each GPU: load, memory, power, temperature and the processes using it. This guide walks through the default output in the order it appears. It then covers the nvidia-smi command options that give you the same readings in a form you can log.
Every field definition comes from NVIDIA's own nvidia-smi documentation. The layout shown is a template, not a capture from a live machine, so it contains no invented readings. If you are new to why these readings matter for serving models, start with what LLM inference is.
Why GPU-Util can mislead is covered in GPU utilization: the lie your dashboard tells you, and app-level tracing in LLM observability. This post stays at the GPU level and links to both.
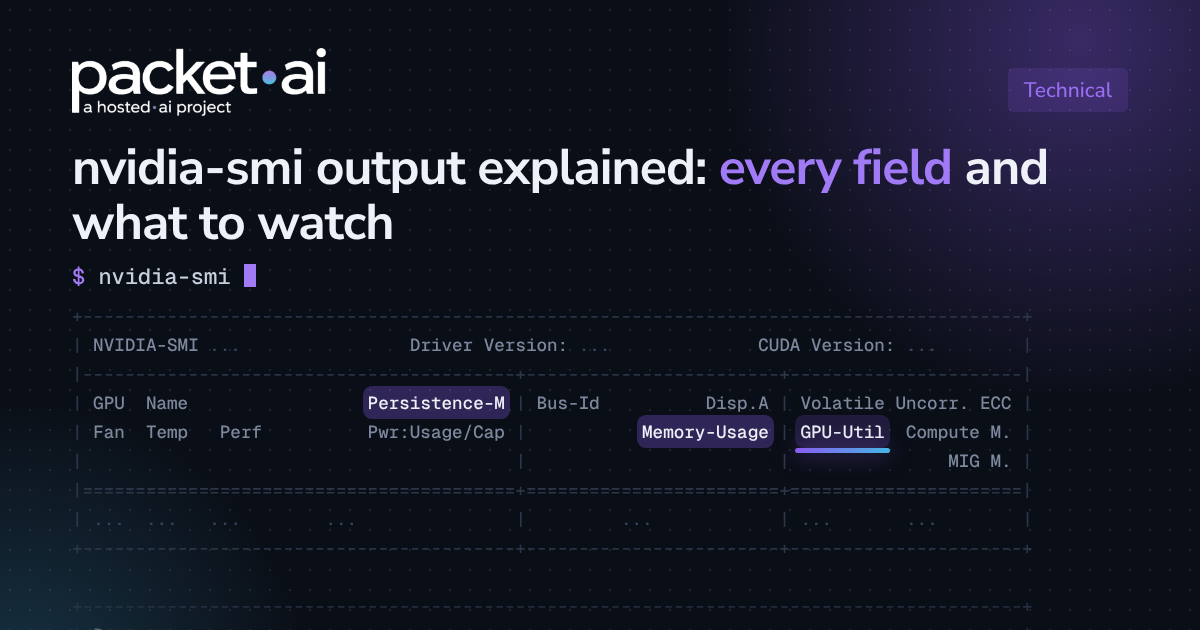
The default view has three parts: a banner with versions, a two-line block for each GPU, and a process table at the bottom. The exact layout varies with the driver version and the GPU. This template shows where each field sits.
+-----------------------------------------------------------------------------------------+
| NVIDIA-SMI <version>              Driver Version: <version>      CUDA Version: <version> |
|-----------------------------------------+------------------------+----------------------+
| GPU  Name                 Persistence-M | Bus-Id          Disp.A | Volatile Uncorr. ECC |
| Fan  Temp   Perf          Pwr:Usage/Cap |           Memory-Usage | GPU-Util  Compute M. |
|                                         |                        |               MIG M. |
|=========================================+========================+======================|
| <index>  <name>                 <state> | <bus id>        <disp> |             <errors> |
| <fan>    <temp>  <perf>    <draw/limit> |       <used / total>   | <util>      <mode>   |
+-----------------------------------------+------------------------+----------------------+
The table below maps each default field to its definition in NVIDIA's documentation and says what to watch. The same fields appear with fuller detail in nvidia-smi -q.
Persistence mode controls whether the NVIDIA driver stays loaded when no client is using it. When it is enabled, the driver remains loaded even without clients such as nvidia-smi or an X server. NVIDIA says this minimizes the driver load latency of CUDA programs.
It is available on Linux only. NVIDIA documents that persistence mode defaults to Disabled after each reboot, so you set it again after boot. Setting it needs root and applies to all GPUs unless you pick one with -i.
sudo nvidia-smi -pm 1          # enable on all GPUs
sudo nvidia-smi -i 0 -pm 1     # enable on GPU 0 only
Persistence mode also changes how you read ECC counters. On Linux the driver unloads when no active client exists, so volatile error counts reset each time a compute app runs unless persistence mode is on or another client keeps the driver loaded.
The banner fields are easy to misread. In the detailed nvidia-smi -q output, NVIDIA labels them KMD Version and CUDA UMD Version, and describes the CUDA value as the latest version the driver supports, not the toolkit on disk. Compute M. then sets how many contexts may share the GPU: Default allows several, Exclusive Process allows one, and Prohibited allows none.
NVIDIA defines GPU-Util as the percent of time over the past sample period during which one or more kernels was executing on the GPU, with a sample period between 1 second and 1/6 second depending on the product.
The definition is about time, not capacity. A reading says how often work was running, and says nothing about how much of the GPU that work used. The memory figure behaves the same way: utilization.memory is the percent of time global device memory was being read or written, which is a different thing from Memory-Usage.
Two cautions come straight from NVIDIA. When ECC is enabled, high GPU and memory utilization can appear during driver initialization because of memory scrubbing. On MIG-enabled GPUs, querying utilization for gpu and memory is not currently supported.
nvidia-smi --query-gpu=utilization.gpu,utilization.memory,memory.used,memory.total --format=csv -l 1For the full argument on why a high GPU-Util can hide idle compute, read GPU utilization: the lie your dashboard tells you. For request-level signals above the GPU, see LLM observability.
Memory-Usage comes from the frame buffer fields: total, reserved, used and free. NVIDIA notes that reported total memory can be affected by the ECC state, because parity bits reduce it by several percent. The driver may also reserve a small amount for internal use, even with no active work.
On systems where GPUs are NUMA nodes, NVIDIA says the accuracy of used memory depends on the operating system's accounting, because the operating system manages that memory. BAR1 memory is reported separately and exists so the CPU or third-party devices can access device memory directly.
Single bit ECC errors are corrected automatically and do not corrupt data. Double bit errors are detected but not corrected. Volatile counters cover the time since the last driver load, and aggregate counters persist as a lifetime count.
NVIDIA says a GPU can retire memory pages or remap rows when they become unreliable. After a double bit error, nvidia-smi -r can reset the GPU, but only when no application is using it. NVIDIA also says GPU reset is not guaranteed to work in all cases and is not recommended for production environments at this time.
Power readings show board draw against the power limit, and you can set the limit with -pl within the minimum and maximum the GPU reports. Average power draw over the last second is only supported on Ampere (except GA100) or newer devices, while instantaneous draw is the last measured value.
For temperature, run the detailed query rather than reading Temp alone. It adds the thresholds that matter: GPU Slowdown Temp, GPU Shutdown Temp and GPU Max Operating Temp. Where a T.Limit sensor exists it reports a margin to the maximum operating temperature, and a value of 0 or lower means the GPU may optimize its clocks for thermal conditions.
nvidia-smi -q -d MEMORY,ECC,TEMPERATURE,POWERIn NVIDIA's documentation, performance states run from P0 (maximum performance) to P12 (minimum performance). Clock fields report the current graphics, SM, memory and video frequencies in MHz. Clocks event reasons then explain why clocks are below what was requested.
If all event reasons read Not Active, NVIDIA says the clocks are running as high as possible. When one is active, it points to the cause.
NVIDIA also reports counters in microseconds for how long each factor has reduced clocks. Idle and Application Clocks Setting are marked deprecated in the documentation.
nvidia-smi --query-gpu=pstate,clocks.sm,clocks.mem,clocks_event_reasons.active --format=csv -l 1The process table lists processes with compute, graphics or other resource use on each GPU. The Type column shows C for compute, G for graphics, M for MPS compute, O for other, and C+G or M+C for combined contexts. GPU Memory Usage is not available on Windows in WDDM mode, because the Windows kernel driver manages memory there.
For logging, NVIDIA's documentation gives you several routes. Without a value, -l repeats every 5 seconds, while dmon samples every 1 second by default and covers up to 16 devices. NVIDIA recommends selecting GPUs by UUID or PCI bus ID, because index order is not guaranteed to stay the same between reboots.
nvidia-smi                       # one snapshot
nvidia-smi -l 1                  # repeat every second
nvidia-smi -L                    # list GPUs with their UUIDs
nvidia-smi -q -d UTILIZATION     # detailed query, selected sections only
nvidia-smi --query-gpu=index,name,utilization.gpu,memory.used,memory.total,temperature.gpu,power.draw --format=csv
nvidia-smi --query-compute-apps=pid,process_name,used_memory --format=csv
nvidia-smi dmon -s pucm          # power and temperature, utilization, clocks, memory
nvidia-smi pmon -s um            # per-process utilization and memory
Run nvidia-smi --help-query-gpu to see which fields your driver supports. NVIDIA marks unsupported data as N/A, and some devices and environments do not support every field.
On packet.ai
You can run every command above on a GPU in the Dynamic GPU cloud. Start with the snapshot, then log utilization, memory, power and clocks together while your workload runs.
Sources
Last reviewed: 10 November 2026. If you want a GPU to run these on, browse available clusters on packet.ai.
Same models. Same API. Fraction of the cost. Start free — no credit card required.
Start building →